
View your statistics
The Overview indicators (courses, leads, views, sponsorship) and the detailed statistics of a course (views, likes, progress).
Updated on 29 September 20261 min read
Overview
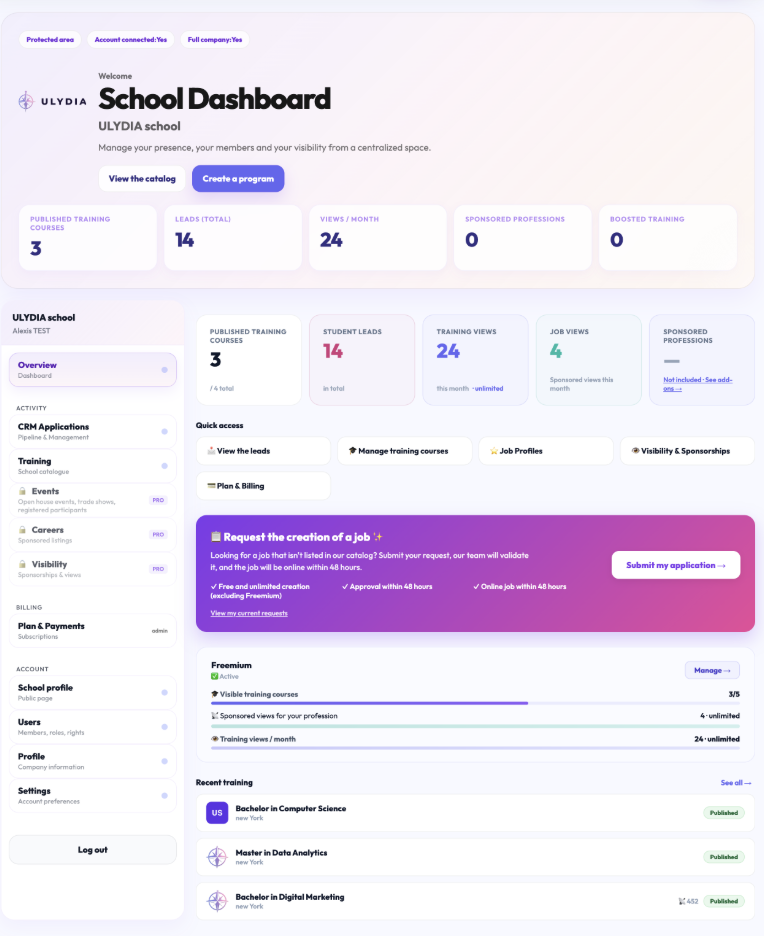
The first section of your dashboard summarizes your activity:
Active plan: your plan, or "Free trial" with the last day of the trial.
Published trainings: the number of online trainings, compared to your plan limit.
Leads: the contacts received: students for a school, candidates for a company.
Training views / month: the views of your training pages during the month. The reset date is indicated.
Sponsored job profiles: your active sponsorships, compared to your rights.
Sponsored job views / month: the displays of your banners on the sponsored job profiles.
Training statistics
In Activity → Trainings, open the statistics of a training:
Views: the number of page views, with their evolution over time.
Likes: the number of visitors who added the training to their favorites, with their evolution.
Average per day and growth: to compare periods.
Candidate tracking
The conversion indicators (candidates, interviews, admitted, conversion rate, average delay) are in the Analytics view of the CRM. See the article on the application CRM.
Is a job missing from the catalog?
From the Overview, Request a job sends a request to the Ulydia team, and View my requests tracks their progress.
Didn't find the answer?
The team replies within 24 hours on business days.